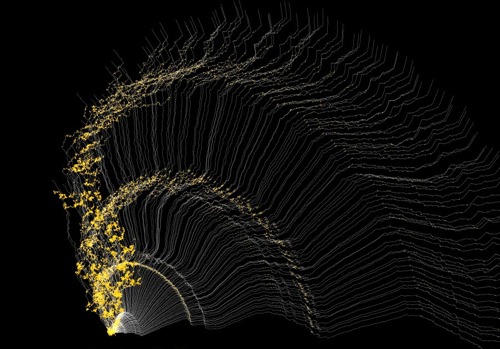
In his keynote for the Sonic Acts festival last week, Dirk de Kerkhoven spoke about data visualization and he briefly showed Narratives 2.0 by Matthias Dittrich. The program visualizes music by segmenting it in different channels and showing them in a fan-like manner. The angle of the line is determined by the frequency of the channel while high levels are colored orange.
In the image above we see the result for Beethoven’s fifth symphony. Quite beautiful. It makes me want to listen to the piece and see if I can follow the lines and intensities. It is nice to look at a piece of music from a different perspective. The purpose of the project is not to create an exact mapping of the frequencies, but to have an aesthetic, artistic representation of it.