

Sonify... Wikipedia
Sonification, and especially data-sonification, is still an underused technique. I’ve been quite interested in sonifications, and have heard both very useful, as well as utterly rubbish applications. I’ve been trying to wrap my head around which sonifications work, and which don’t.
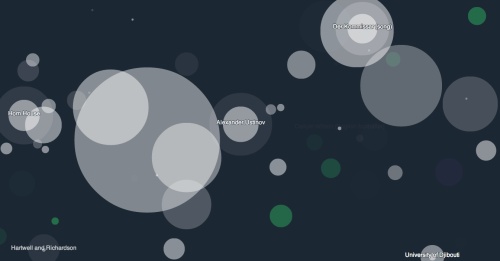
In the “Sonify…” posts, I will post about different ways of sonifying data. This time: Sonfiying Wikipedia. Listen to Wikipedia by Hatnote is a sonification and visualisation of changes being made to Wikipedia. Hatnote is Mahmoud Hashemi and Stephen LaPorte, both interested in “Wiki life”.
“Listen to Wikipedia” sonifies changes from Wikipedia-articles in real time. Bell sounds indicate additions, and string plucks indicate subtractions to an article. Pitch changes according to the size of the edit. It’s worth noting that Wikipedia is maintaned by both bots and humans, and it’s only through these web experiments that we can see or hear that labour force.
What do you think? Is this a good sonification of the data of Wikipedia?
 Post a Comment